The 7 Best Client Dashboard Software Tested & Reviewed [2026]
Looking for the best client dashboard software? I tested 7 no-code tools to see which ones are easiest to set up, client-friendly, and worth using in 2026.

![The 7 Best Client Dashboard Software Tested & Reviewed [2026]](https://storage.ghost.io/c/6f/87/6f878703-0e71-4ebd-8755-324628c2c39c/content/images/size/w2000/2026/06/iStock-2226095879.jpg)
I tested no-code dashboard platforms to find ones that connect live data and look professional without requiring a developer. These 7 tools will finally deliver both in 2026.
7 Best no-code client dashboard tools: At a glance
Client dashboards vary a lot. Some just show data, while others are full portals where clients log in, see your branding, and collaborate with you. Most charge per user or workspace and add fees for extra data sources or complex features.
Here's how they stack up:
| Tool | Best for | Starting price (billed annually) | Key strength |
|---|---|---|---|
| Assembly | Client portals with embedded dashboards | $39/month | All-in-one client portal combining messaging, billing, file sharing, payments, and dashboard embedding for a branded client experience |
| Databox | Marketing agencies tracking KPIs | $159/month | Extensive native integrations (130+) with pre-built templates and metrics tailored for marketing and performance tracking |
| AgencyAnalytics | SEO tools and client reporting combined | $25/client/month | Built-in SEO modules (site audits, rank tracking, backlinks) and white-label dashboards |
| Geckoboard | Teams displaying live metrics on office screens | $119/month | TV-optimized dashboards with real-time updates, kiosk mode, and easy big-screen display |
| Klipfolio | Technical analysts needing deep customization | $120/month, billed annually | Advanced data customization via SQL queries, API connectors, and formula-based manipulation |
| Grow | SMBs without dedicated data science teams | Custom pricing | No-code full-stack BI with built-in ETL, unlimited users, and 100+ connectors for easy data blending without technical expertise |
| Cyfe | Budget-conscious marketers | $29/month | Broad integrations (100+) with pre-built widgets and custom data options for all-in-one monitoring |
1. Assembly: Best for all-in-one branded client dashboards
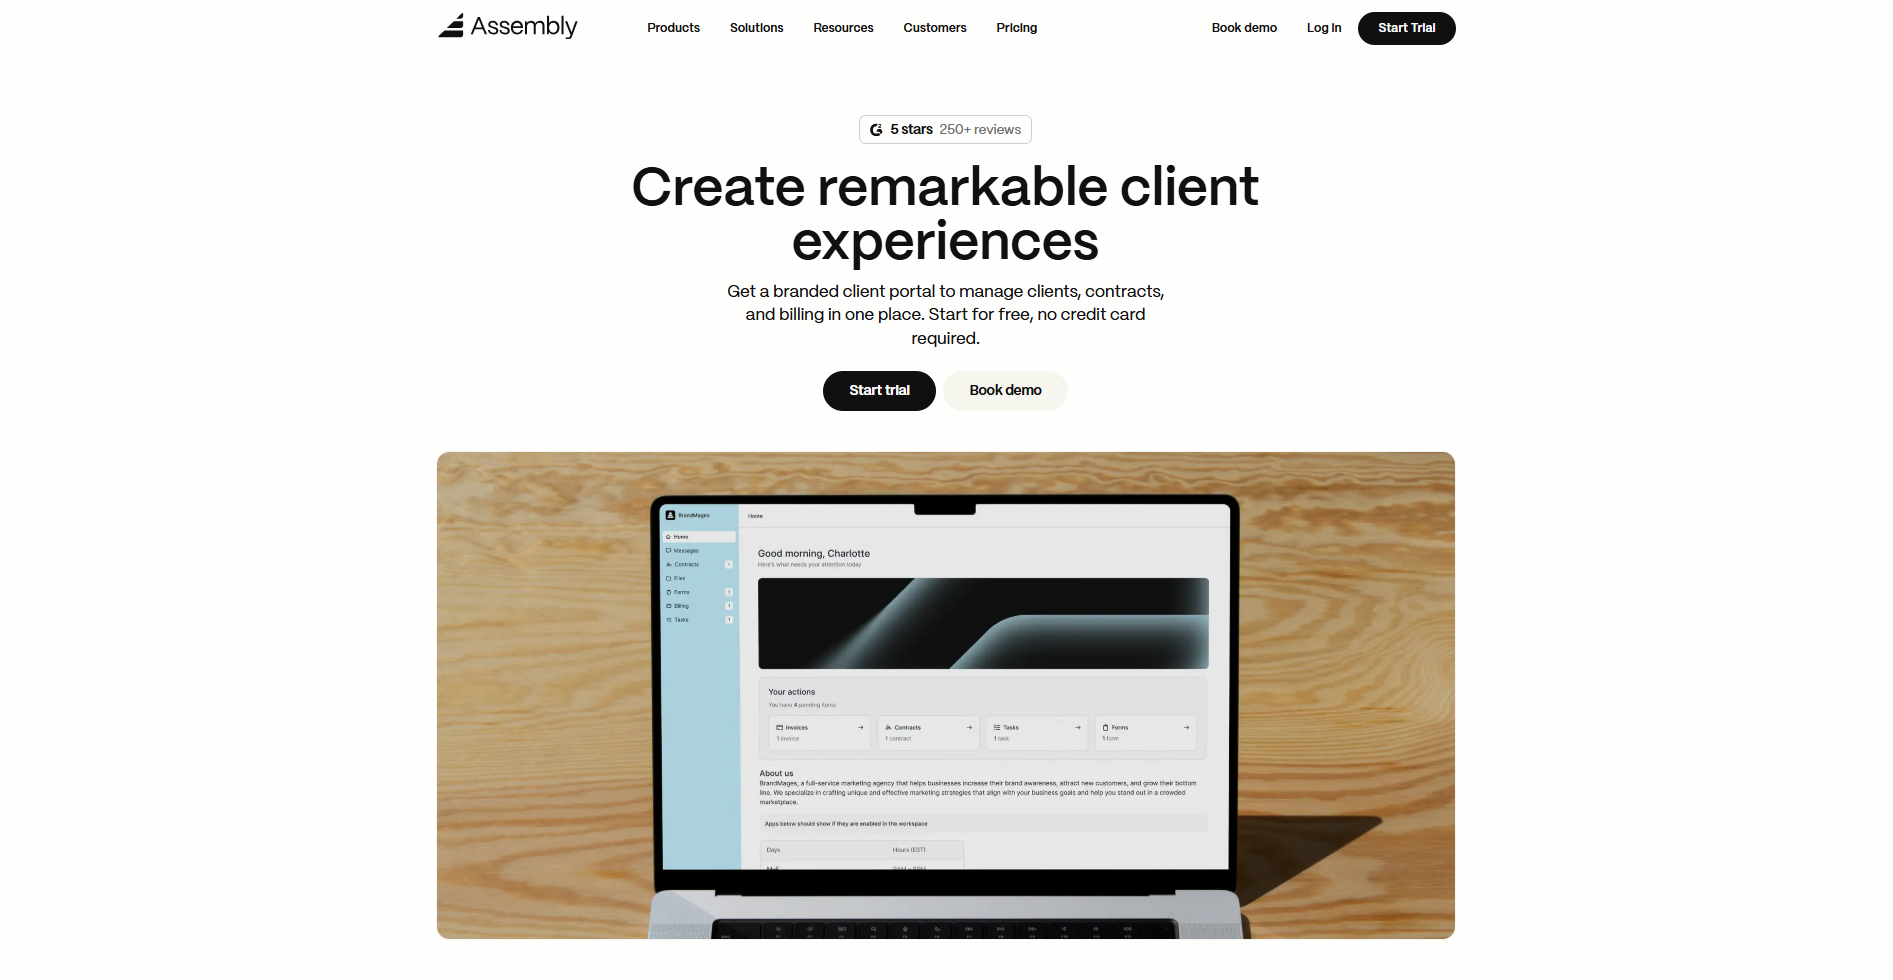
- What it does: Assembly is an AI-powered client portal that brings messaging, file sharing, invoicing, contracts, tasks, and embedded dashboards into one white-labeled workspace.
- Who it's for: Agencies, consultants, accountants, and service firms managing multiple clients who need everything in one branded space.
I set up three client portals in Assembly to test different workflows, and each one took about five minutes from start to finish. The interface looks clean and straightforward, which makes testing easier.
I connected Power BI and Databox using iframes so clients could check their metrics directly inside the portal instead of waiting for static reports in their inbox. The embedded dashboards updated in real time without any lag.
Assembly handles pre-sales and post-sales tasks in the same workspace. You can add custom fields, internal notes, and private chat before inviting a client, which helps your team get organized before the client sees anything. Once a client signs up, they can access messages, files, contracts, tasks, and invoices in the same record.
The AI Assistant drafts responses and summarizes client history, which cuts down admin time for routine tasks. You also get white-label options with custom domains so clients see your branding instead of Assembly's. This gives clients a dedicated space to track work, share files, sign contracts, and pay invoices.
Key Features
- Client records: Notes, tasks, messages, files, payments, and activity always stay together.
- Branded client portal: One space for updates, files, contracts, and invoices. Clients know where to go.
- Embedded dashboards: Drop Power BI or Databox dashboards right in. Clients see metrics next to the work.
- Billing and contracts: Agreements, signatures, and invoices in one workspace.
- AI Assistant summaries: Quick recaps so you skip scrolling through two weeks of messages before calls.
Pros
- Pre-sales and delivery work stay in one system
- Clear split between what your team sees and what clients see
- The client portal looks polished without extra setup
Cons
- Learning curve if your team is used to simpler tools
- Best suited for service firms with ongoing client relationships
Pricing
You can get Assembly from $39/month for the Starter plan.
Bottom Line
Assembly works when you need live metrics where clients already check tasks, billing, and messages. Everything stays in one place. No more jumping between tools or exporting spreadsheets at 11 PM.
2. Databox: Best for fast KPI dashboards for agencies
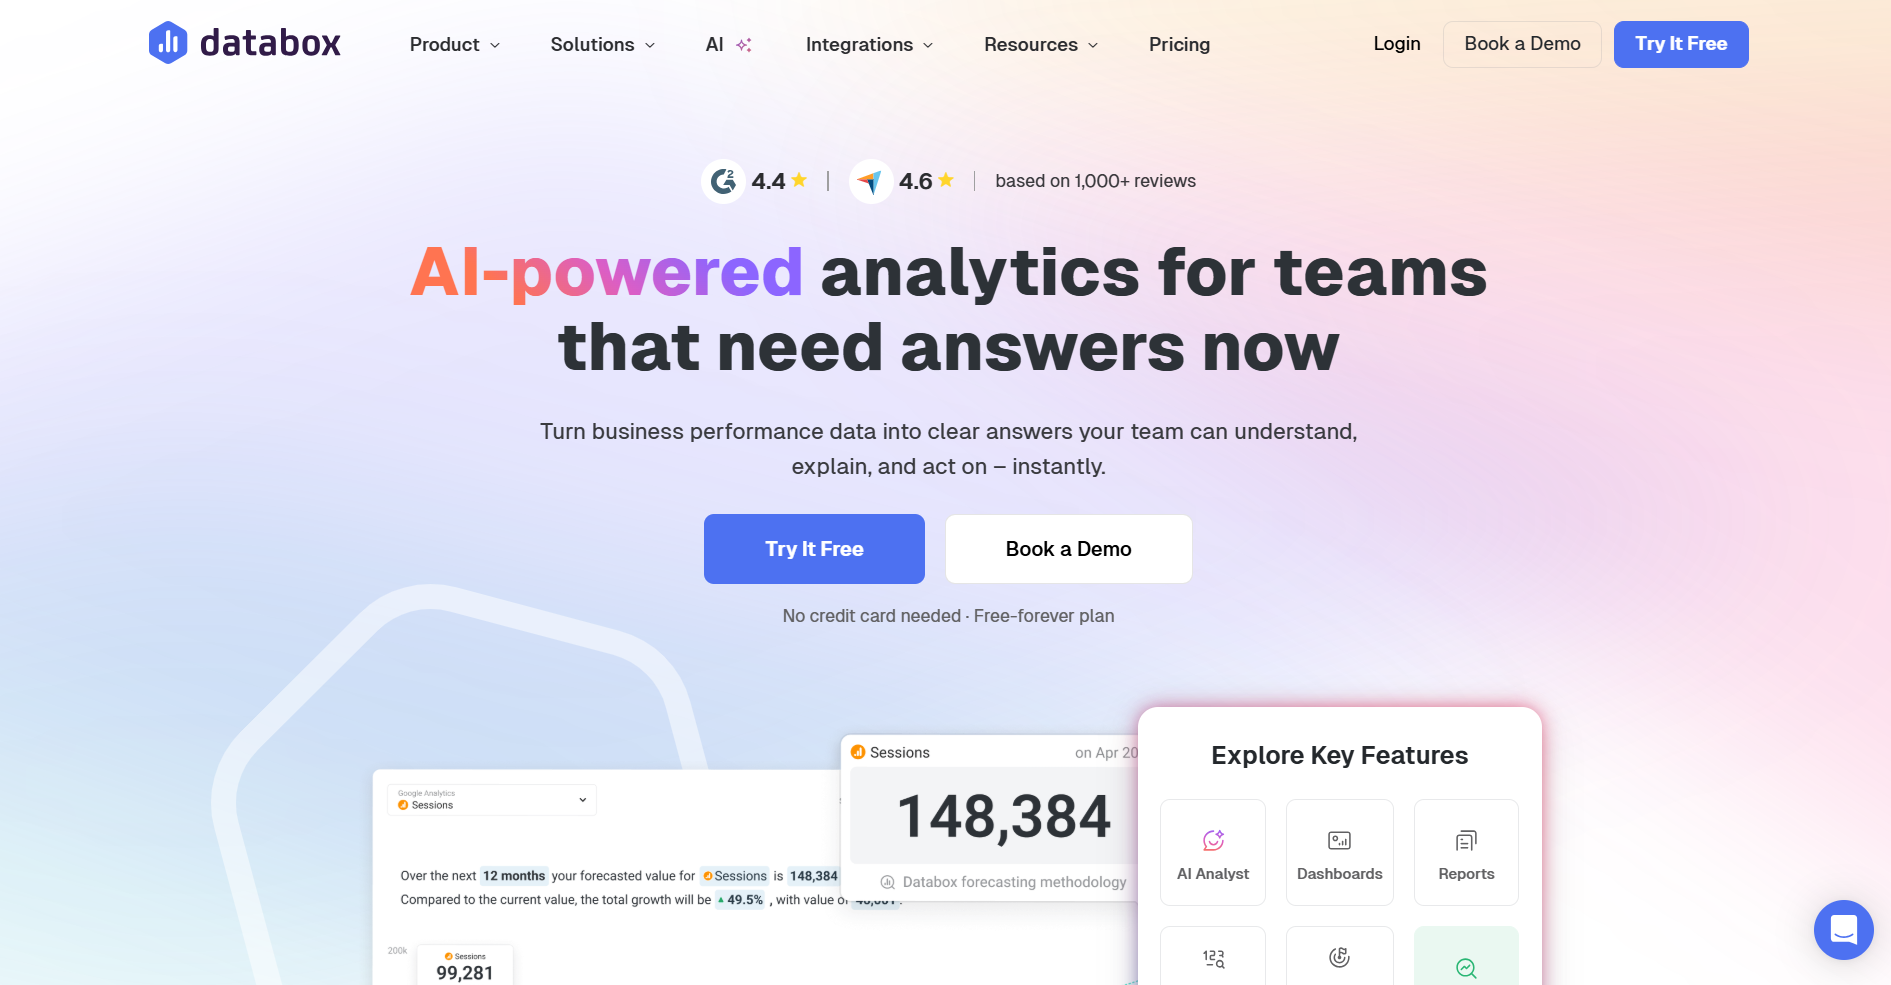
- What it does: Pulls marketing and sales data from multiple platforms into interactive dashboards with row-level drill-downs, custom KPIs, and white-label reporting.
- Who it's for: Marketing agencies juggling multiple paid ads and social media data sources. Teams that need client reports that don't take three hours to build.
Databox pulls marketing and sales data into dashboards you can share with clients. I connected Google Analytics, Facebook Ads, and HubSpot, and had something working in ten minutes without needing to check the docs for basic setup.
The breakdown feature worked well because I could click any metric to see the raw data behind it. Custom KPIs don't require SQL, which saved me from writing queries every time I wanted to track something new. The built-in templates gave me a solid starting point, making Databox a good fit for agencies that need client dashboards without spending hours on setup.
Key Features
- 130+ integrations: Connects Google Ads, Meta, HubSpot, Shopify, among others
- Drill down on everything: One click to row-level data
- AI spots anomalies: Flags unexpected spikes or drops
Pros
- Unlimited users on every plan (matters when 8 people need dashboard access)
- Pre-built templates get you 80% there
- 99.99% uptime over 90 days
Cons
- Datasets take time to figure out if you're new to the tool
- Steep pricing if you're a two-person shop
Pricing
The Pro plan costs $159/month, billed annually, with unlimited users.
Bottom Line
Databox works when you need client dashboards fast. It handles metrics well. Many firms move to an all-in-one portal like Assembly. In this way, they connect dashboards, billing, contracts, and client communication without juggling.
3. AgencyAnalytics: Best for agencies with built-in SEO tools
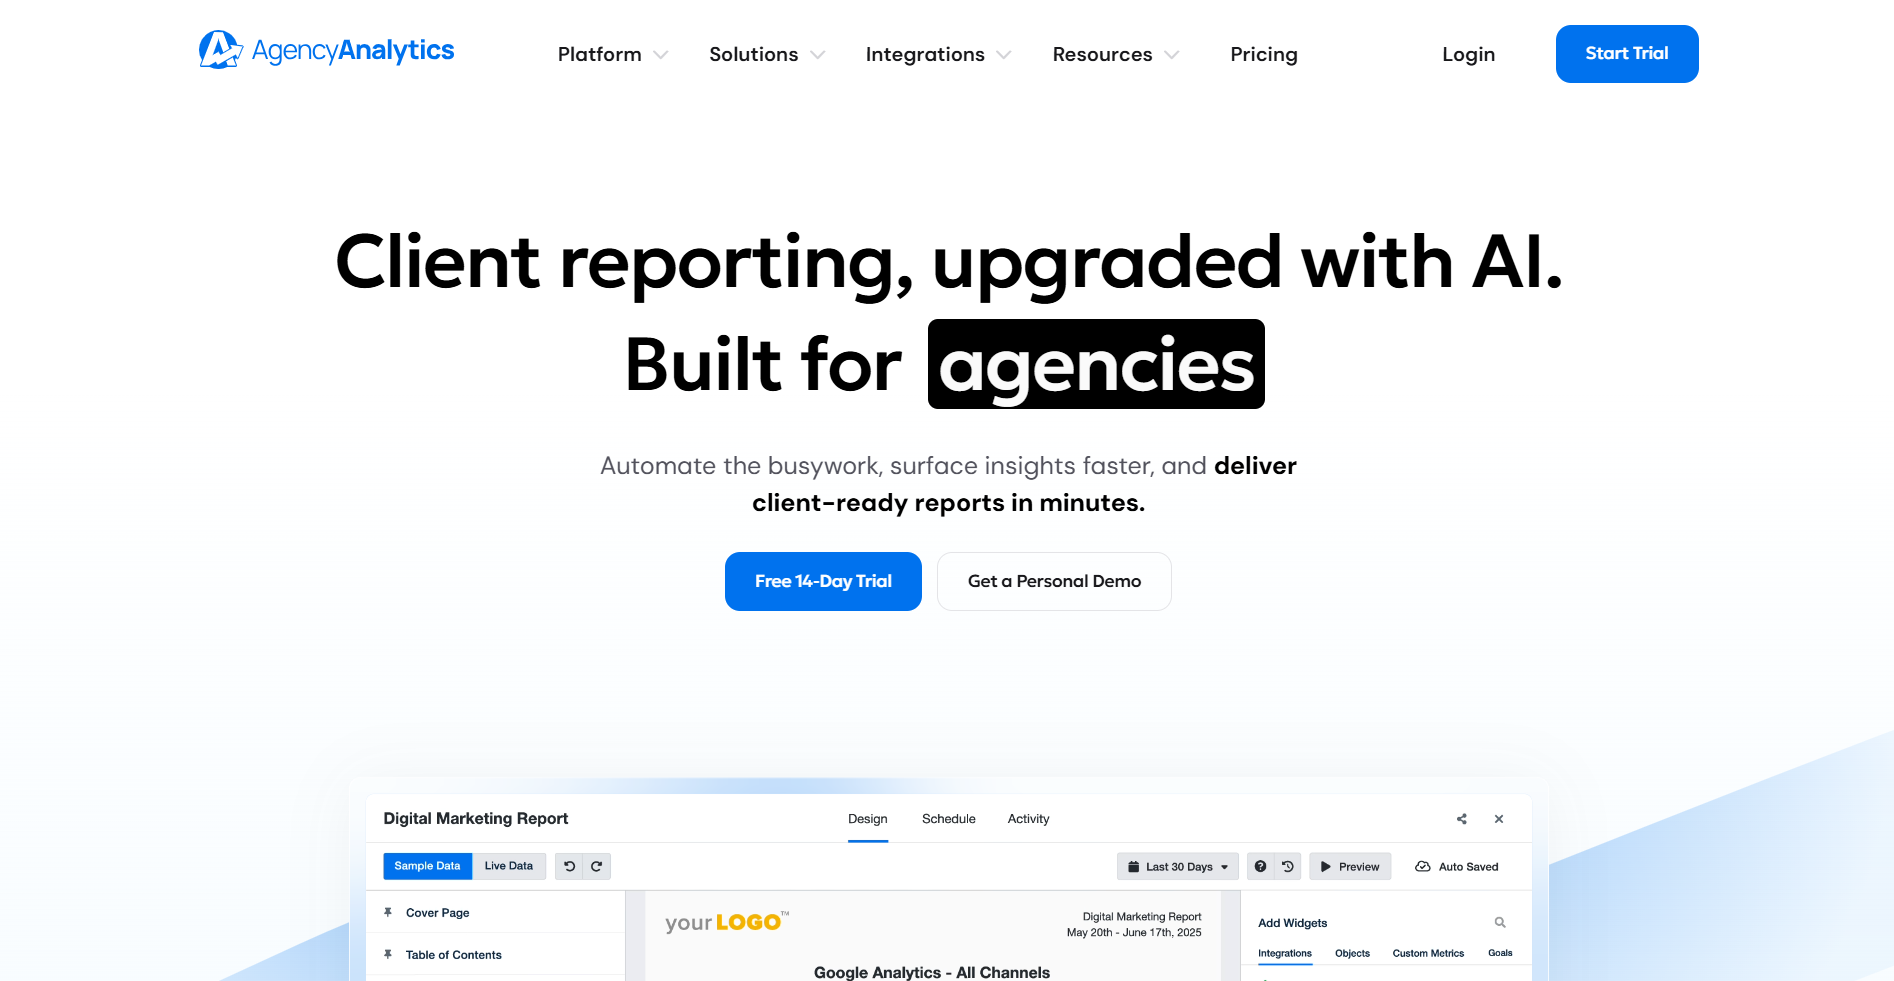
- What it does: Combines client dashboards, automated reporting, and SEO modules (site audits, rank tracking, backlinks) with white-label branding.
- Who it's for: Digital marketing agencies running SEO, PPC, and social campaigns for multiple clients who want reporting and SEO tools in one place.
I tested AgencyAnalytics to see if it actually saves time on client reports, and it does. I connected a few marketing accounts and set the platform to email reports on a schedule, which means my clients can check their campaign metrics whenever they want instead of waiting for me to pull numbers and send PDFs.
The built-in SEO tools saved me from paying for separate subscriptions. I ran a site audit for a test client and found crawl errors without leaving the platform. Rank tracking updates daily, while backlink monitoring flags new or lost links as they happen.
Key Features
- 80+ marketing integrations: Connects Google Ads, Analytics, Facebook, Instagram, LinkedIn
- White-label portals: Custom domain, logo, and branded dashboards
- SEO modules included: Site auditor, rank tracker, backlink manager
- Automated reporting: Schedule reports with pre-built templates
Pros
- Saves hours with automated reporting templates
- Simple interface for clients to navigate
- Strong white-label branding options
Cons
- Can't add multiple accounts from the same platform to one report
- Advanced features locked behind higher-tier plans
Pricing
The freelancer plan starts at $25/client/month, which includes basic reporting features.
Bottom Line
AgencyAnalytics works if you need SEO tools and client reporting in one platform. The automations save time, but expect to validate audit results.
4. Geckoboard: Best for real-time office dashboards
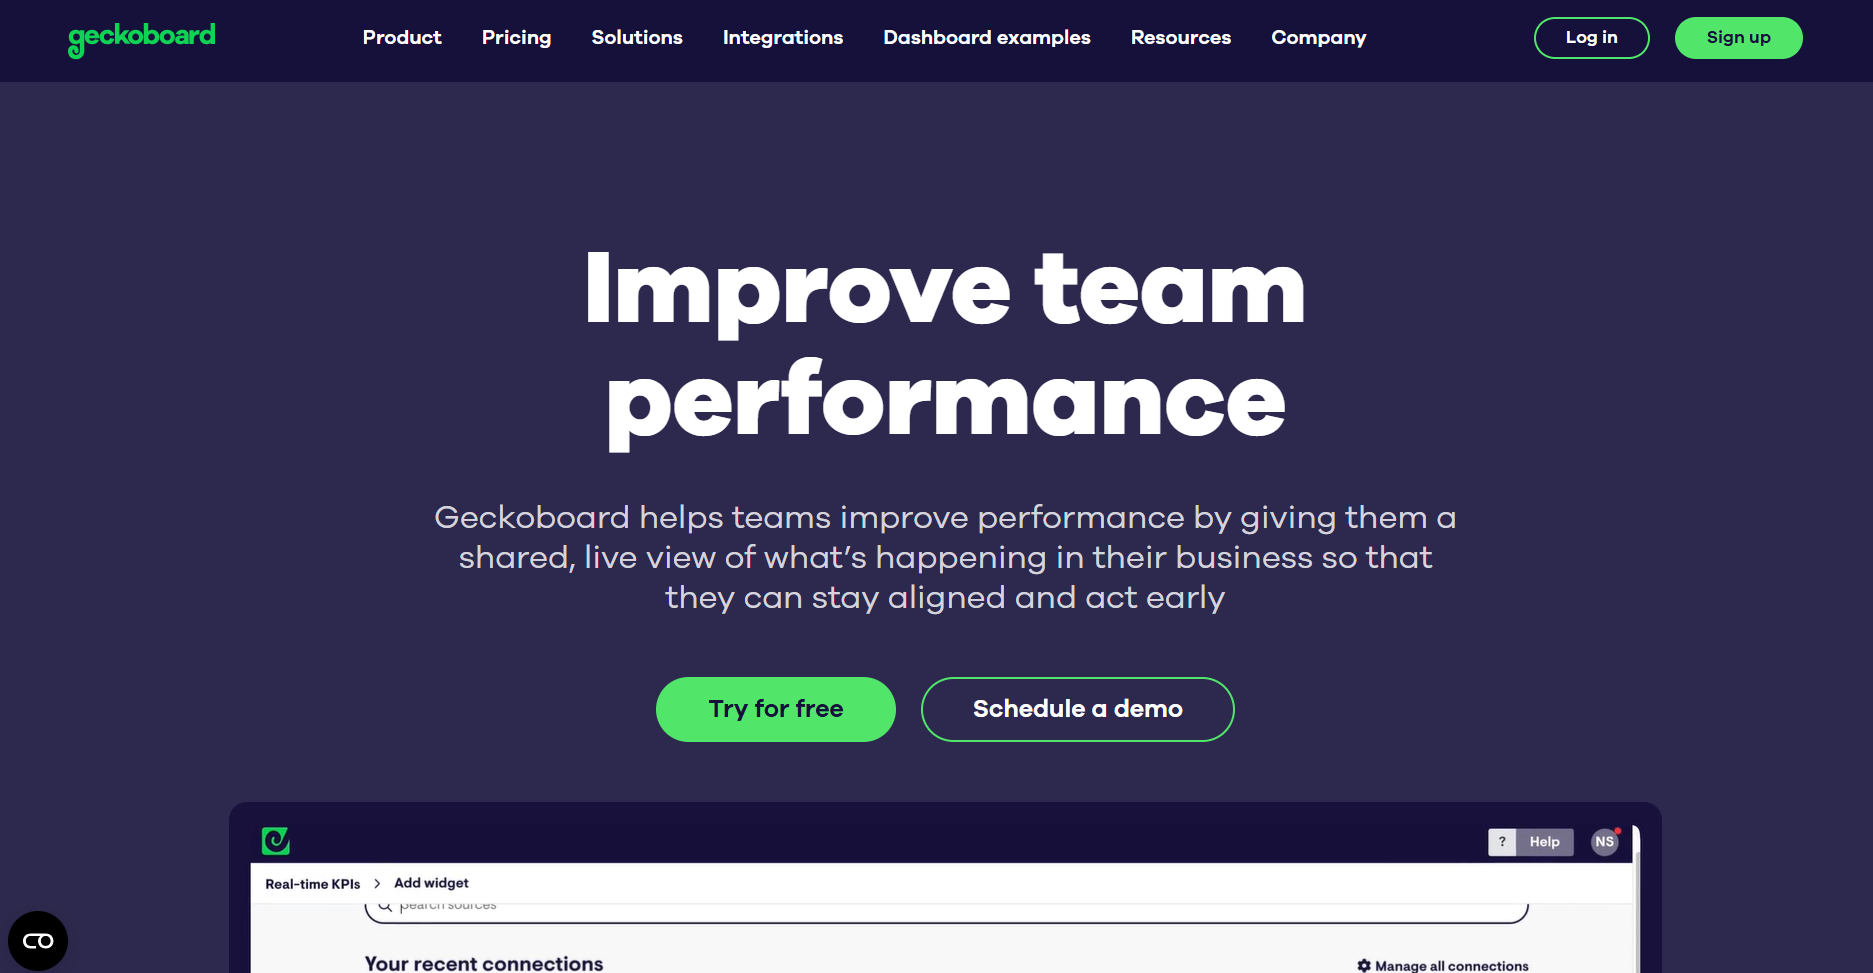
- What it does: Connects sales, support, and analytics tools to real-time dashboards optimized for TV displays with scheduled snapshots to Slack and email.
- Who it's for: Teams that want live KPI tracking displayed on office screens without handling a difficult technical setup.
I connected HubSpot, Zendesk, and Google Analytics to test multi-source dashboards, and the whole setup took about ten minutes. Widgets looked clean on a mounted TV, and metrics refreshed in real time without any lag.
Adding widgets to Geckoboard slowed the process because each one required going through the integrations page instead of drag-and-drop. That friction adds up when you're building multiple dashboards for different teams or clients. Geckoboard works well for office displays that need live metrics, but it feels clunky if you're constantly tweaking layouts.
Key Features
- 90+ integrations: Connect HubSpot, Salesforce, Zendesk, Google Analytics, and spreadsheets directly.
- TV mode: Display live dashboards on office screens with auto-refresh.
- Scheduled snapshots: Send dashboard screenshots to Slack, Teams, or email automatically.
Pros
- Fast initial setup for basic dashboards
- Excellent support team (consistently praised across reviews)
- Clean visuals that work well on large displays
Cons
- Widget management lacks drag-and-drop efficiency
- Limited font and layout controls on lower tiers
Pricing
The starting plan begins at $119/month, billed annually for single dashboards.
Bottom Line
Geckoboard delivers solid TV dashboards for offices displaying live metrics, though widget editing slows down multi-dashboard setups. If you need client-facing portals with billing and task management alongside dashboards, Assembly connects those workflows in one system.
5. Klipfolio: Best for advanced metric blending
- What it does: Combines spreadsheet-style formulas with dashboard visualization to pull data from CRM, advertising, analytics, and database sources with custom calculations and automated refresh.
- Who it's for: Teams pulling metrics from multiple tools into one dashboard. Technical analysts need flexible metric manipulation without full coding.
Klipfolio manages data from multiple sources. I tested it with Google Analytics, Salesforce, and spreadsheets, and the metrics library covered most of what I needed without requiring much customization. However, custom calculations took longer than expected, as the interface requires more manual configuration than drag-and-drop tools.
SQL and REST API access allow you to extract custom data when the predefined options aren't enough, making the steeper learning curve worthwhile if you're tracking complex metrics across different platforms.
Key Features
- 130+ data sources: Connects Salesforce, Google Analytics, HubSpot, Excel, Sheets, plus SQL and REST API
- Automated refreshes: Live updates on schedule, no more weekend data exports
- 30+ visualizations: Drill-downs, pixel-level layouts, white-label branding, and custom formulas
Pros
- Strong flexibility for complex metrics across sources
- Works well for teams who speak formulas and SQL fluently
- Pixel-level control keeps client-facing dashboards looking sharp
Cons
- Takes time to learn beyond basic dashboards
- The interface feels a little bit dated compared to newer tools
Pricing
Klipfolio starts at $120/month, billed annually for unlimited users and 3 dashboards.
Bottom Line
Klipfolio works when you need custom metrics across multiple platforms and don't mind the setup time. Teams use Assembly instead because it combines dashboards with messaging, billing, and file sharing without the technical overhead.
6. Grow: Best for centralized business reporting
- What it does: Consolidates sales, marketing, finance, and operations data into no-code dashboards with built-in ETL, automated refresh, and unlimited user access.
- Who it's for: Small to mid-sized teams without data engineers on staff. Makes sense if you're sick of exporting spreadsheets manually.
Grow sits between basic dashboards and enterprise BI tools. I tested it with Salesforce sales data, Google Analytics traffic, and QuickBooks invoices, and the drag-and-drop builder handled standard setups without needing custom code. Performance stayed solid with normal data volumes, but large datasets slowed things down.
It works well for teams that need business intelligence without hiring data engineers or learning complex SQL queries. Most small agencies use it to consolidate client metrics from multiple platforms in one dashboard.
Key Features
- 100+ data connectors: Integrates HubSpot, Salesforce, Google Analytics, QuickBooks, and SQL databases
- Built-in ETL pipeline: Clean and blend data without writing code
- Unlimited user access: Share dashboards across teams without per-seat charges
- Automated scheduling: Email delivery of dashboard snapshots and real-time refresh
Pros
- Interface works for non-technical staff without training friction
- Fast deployment gets standard metrics running quickly
- Strong customer support consistently rated by users
Cons
- Complex data blending may need a few tries to get right
- Built more for general BI than deep financial modeling
Pricing
Grow uses custom quotes; reach out for specifics.
Bottom Line
Grow works for teams that need centralized dashboards without hiring data engineers. If you need highly custom analytics, you might hit limits.
7. Cyfe: Best for entry-level client reporting for small teams
- What it does: Aggregates marketing, sales, and web metrics into customizable dashboards with scheduled report delivery and white-label branding for client sharing.
- Who it's for: Small businesses, solo marketers, agencies, and startups seeking cost-effective metric monitoring across multiple channels
I set up Cyfe and had a working dashboard in minutes using pre-built widgets. Large tiles and clear labels made scanning metrics easy on a single screen, which works well when you need quick visibility across multiple channels.
Dashboards can be sent as a link, displayed on a TV in presentation mode, or emailed on schedule as a PNG or PDF. This eliminated the need to walk clients through the tool during check-ins.
Key Features
- Pre-built integrations: 100 integrations and 250+ metrics included.
- Report automation: Scheduled delivery in PNG, PDF, JPEG, and CSV formats
- Agency customization: Branded dashboards with custom domains and logos
- Presentation mode: Display live metrics on screens for visibility
Pros
- Fast setup gets new panels running in minutes
- Unlimited users on premium tiers without per-seat fees
- Easy sharing through links, emails, or TV mode for stakeholder updates
Cons
- Custom formulas and advanced metrics are limited
- Historical storage runs tight on lower-tier plans and requires external exports
Pricing
The starter plan begins at $29/month for 2 dashboards and 1 user.
Bottom Line
Cyfe works well for teams that need a quick dashboard setup without much customization. It's affordable and gets basic multi-channel visibility running fast, though you'll outgrow it if you need advanced features or deeper data analysis.
How I tested these no-code client dashboard tools
I wanted to see how they handled actual business data, not the clean demos that vendors show in sales calls. I built the same dashboards in every tool: marketing performance, financial snapshot, and project status. This showed me which platforms kept data synced and which broke when APIs timed out, or data got messy.
Here's what I focused on:
- Data connection stability: I tracked how often they lost sync over two weeks and whether reconnection happened automatically or required manual fixes.
- Real-time accuracy: I compared how fast changes in source data (like new Stripe payments) appeared on the dashboard. Some tools lagged 15-30 minutes despite claiming real-time updates.
- Client-facing usability: I shared some panels with colleagues playing the client role and watched them try basic tasks like finding metrics, comparing periods, and exporting reports without guidance.
- Performance under load: I added 50+ widgets to test where it slowed down or timed out.
- Brand customization: I checked whether I could match client colors, adjust layouts, and create custom metrics without code.
Which client dashboard tool should you choose?
Most dashboard tools focus on connecting data sources or building charts, but they don't always keep the client relationship connected to the work itself. I've grouped these tools by what they actually solve, based on how they performed during my testing.
Choose:
- Assembly if you need dashboards embedded where clients already check billing, contracts, and messages in one branded portal.
- Databox if your agency needs pre-built marketing templates and drill-down reporting that shows row-level data behind every metric.
- AgencyAnalytics if you need built-in SEO modules (site audits, rank tracking, backlinks) alongside white-label client reporting."
- Geckoboard if you need a TV-ready control panel that refreshes automatically for office displays.
- Klipfolio if you pull data from 10+ sources and need custom formulas or SQL queries to blend everything together.
- Grow if you want full-stack BI without hiring data engineers, and your team needs centralized reporting across departments.
- Cyfe if budget matters most and you only need basic multi-channel monitoring.
Avoid dashboard tools entirely if:
- You only need static reports sent weekly or monthly (use your existing analytics platform instead)
- Your clients don't need real-time access to metrics
- You're tracking fewer than 3-4 data sources (spreadsheets work fine)
My final verdict
After testing dashboard tools, most fall into two camps. Pretty charts that don't update right, or solid data connections that look like spreadsheets.
Databox and Klipfolio handle complex blending but take time to learn. Geckoboard looks good on TVs, though widget setup slows you down. Cyfe keeps costs low but has data retention issues.
The bigger problem? Dashboards sit alone. Clients check metrics, then email about invoices or last month's work. Assembly connects dashboards to all work complete funnels. When clients check performance, they see invoices, messages, files, and tasks in the same space.
Get started with Assembly
Dashboards are useful, but alone, they leave clients asking questions somewhere else. Assembly gives teams a branded portal where metrics sit next to tasks, messages, files, and billing in the same client record.
It works after the deal is signed and also supports pre-sales. Teams can create client records early and add custom fields, internal notes, and private chat before inviting anyone. When the client is ready, nothing gets rebuilt.
Here's what that looks like:
- One client record, start to finish: Dashboards, messages, files, contracts, and payments stay connected. Clients see metrics in context, not alone.
- A branded workspace: Clients know where to go. One portal for updates, approvals, files, and invoices.
- Faster prep: The assistant pulls short summaries of recent activity so calls start with clarity.
- Less admin work: Tasks, reminders, and follow-ups stay in the same system.
If you want to be inside the actual client relationship, not beside it, Assembly is built for that. Start your free Assembly trial today.
Frequently asked questions
Can I embed live dashboards directly in Assembly's client portal?
Yes, you can embed live dashboards using an iframe or public link, and platforms like Power BI, Tableau, and Looker Studio all work without issues. Clients see the numbers right next to files, messages, and invoices without needing another login.
How does Assembly keep dashboard data connected to client work?
Dashboards appear in the same view as tasks, approvals, content, and invoices. Clients can see the metrics next to the work that generated them without switching tools.
What makes Assembly different from tools like Databox or Geckoboard?
Databox and Geckoboard focus only on visualizing metrics, while Assembly embeds dashboards alongside contracts, billing, files, and conversations so clients can act on what they see instead of emailing you with follow-up questions.
Do client dashboards need to be real-time to be useful?
Not always. Daily or weekly refreshes work fine for most teams. Real-time updates matter when clients check numbers frequently or decisions need to happen fast.
When does an all-in-one platform make more sense than a dashboard-only tool?
When clients look at metrics and immediately need context about invoices, tasks, or next steps. Keeping everything in one place cuts the back-and-forth that happens when using separate tools.